Organizations today have access to a high volume of data. But it is not going to benefit them unless it is visualized. In order for entrepreneurs, business owners, partners & managers to take decisive action, they must be able to visualize data efficiently, accurately & quickly.
A recent study proves that visual data has increased profitability & efficiency of businesses by allowing to make them more accurate & faster decisions.
Kibana is one such browser-based data visualization & exploration tool. It is a boon for enterprises to visualize data in a quick & precise manner. It is the part of ELK stack that is used to visualize Elasticsearch documents & enables developers to get a deep insight.
The tool allows you to analyze large amount of data in the form of pie charts, line graphs, histograms, region maps, bar charts, etc., which can be used for operational intelligence use cases, application monitoring & time-based analytics.
Top 5 benefits of using Kibana in your web application
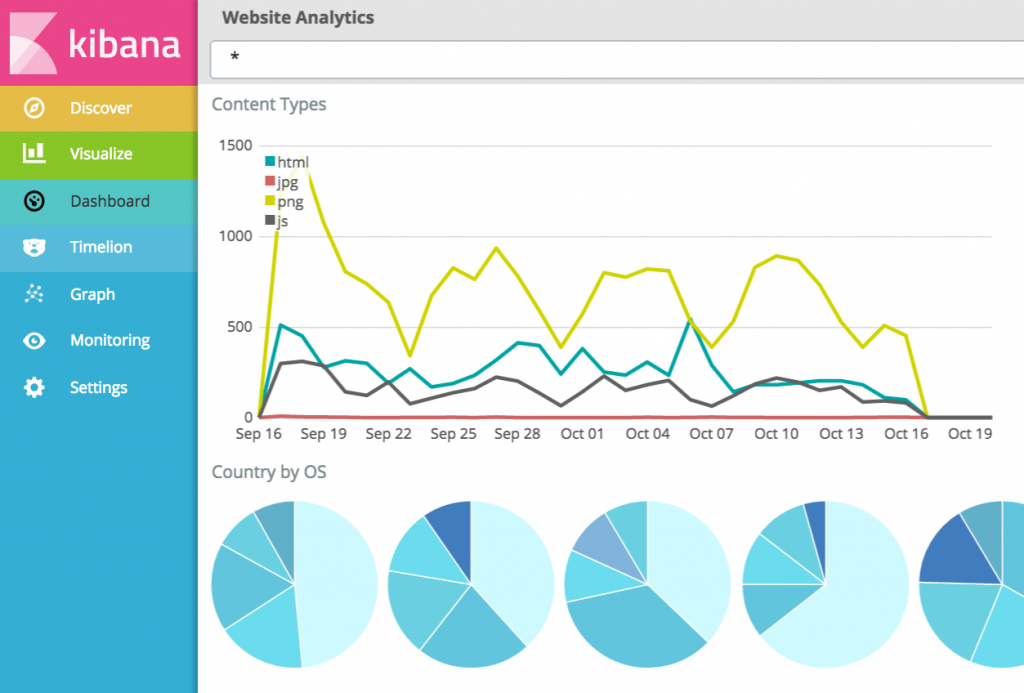
#1 Easy Visualization
Kibana offers out of the box and easy-to-understand visualization options. Using its a whole host of efficient & powerful features, you can create a variety of charts, maps, graphs & histograms. You can also utilize Vega grammar to create your own custom visualizations.
#2 Create Intuitive charts
Kibana allows developers to create insightful charts & reports, which can be used to navigate through the huge clusters of data. With Kibana, you can dynamically move timeline windows, take a quick look at data subsets and dig into the data reports to draw actionable insights from the log data.
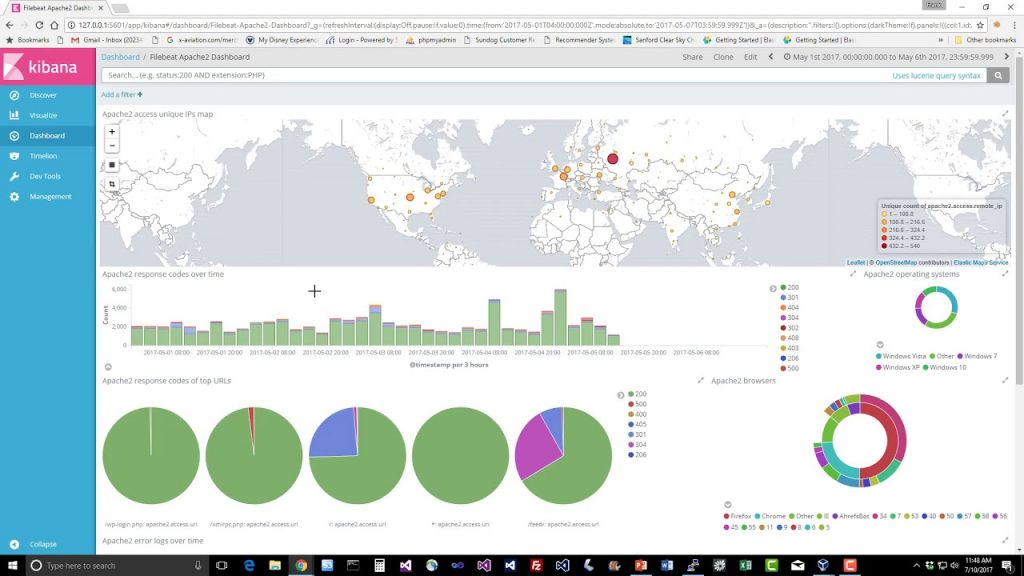
#3 Inbuilt Aggregations and filters
Kibana offers tons of inbuilt filters & aggregations that help you run a range of analytics programs, like top-N queries, histograms & so on with just a few clicks. You can easily get required details for a specific input using search queries & filters.
#4 Support for mapping
Kibana comes with co-ordinate and region mapping feature that shows the realistic view of data on the geographical map. Just add a layer of geographical map on top of your data and you will be able to visualize data on maps.
#5 Free to use
Kibana is an open-source visualization tool that can be run on Amazon Elasticsearch service, on-premises, or on Amazon EC2. When using on-premises or Amazon EC2 deployments, the user needs to manually install Kibana software and is responsible for managing the cluster. When using with Amazon Elasticsearch, Kibana is implemented automatically in your domain and taking care of all the operations to manage the cluster.
Final Thoughts
All the above-mentioned benefits of Kibana can only be yielded when you know how to use it & have an expert available to you. Many businesses & e-commerce owners choose to hire third-party database managers, so they can solely focus on their web application.
Being a leading web development service provider, Velox Softech has a dedicated team of Elasticsearch & Kibana professionals on board who can help you fully leverage the power of Kibana to visualize & monitor data in real-time.

